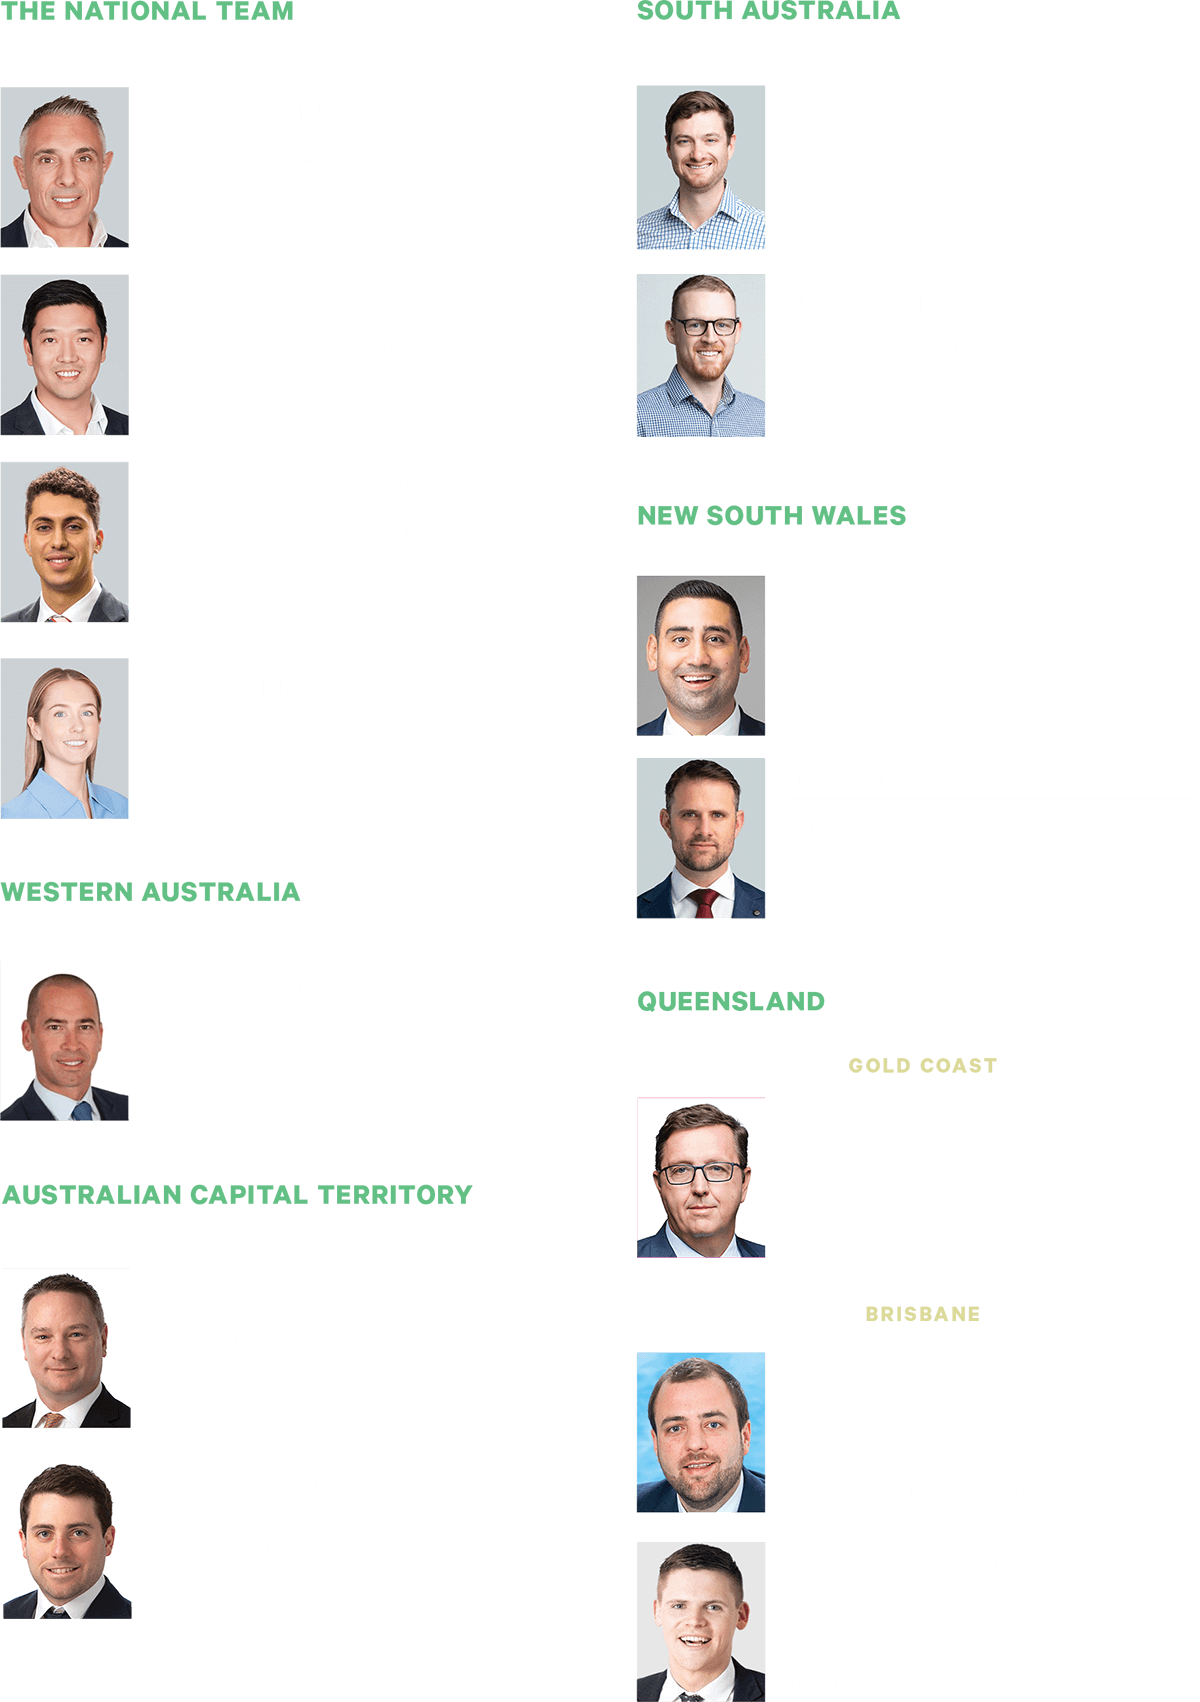
Our Track
Record

Our strong track record within the healthcare sector is what you might expect from commercial agents who specialise in this market sector. Our team’s success comes from our people, their experience, market knowledge and applying a combination of winning factors:

National and international teams working as one

Wide reach giving access to more buyers

Strategic industry relationships

Unmatched buyer database and digital marketing strategies

Bilingual marketing

Proven sales strategies

Asian buyer strategy and international reach

We invite you to learn more about how we can help you achieve your investment goals.

Our Buyers look
all over Australia

Our wide Reach Includes:

  • National Childcare buyers
  • National Childcare developers & operators
  • Metropolitan investors
  • National retail buyers
  • Victorian based retail investors
  • National Asian retail investors
  • Asian investors

Our Focus...

...More buyers for your childcare assets

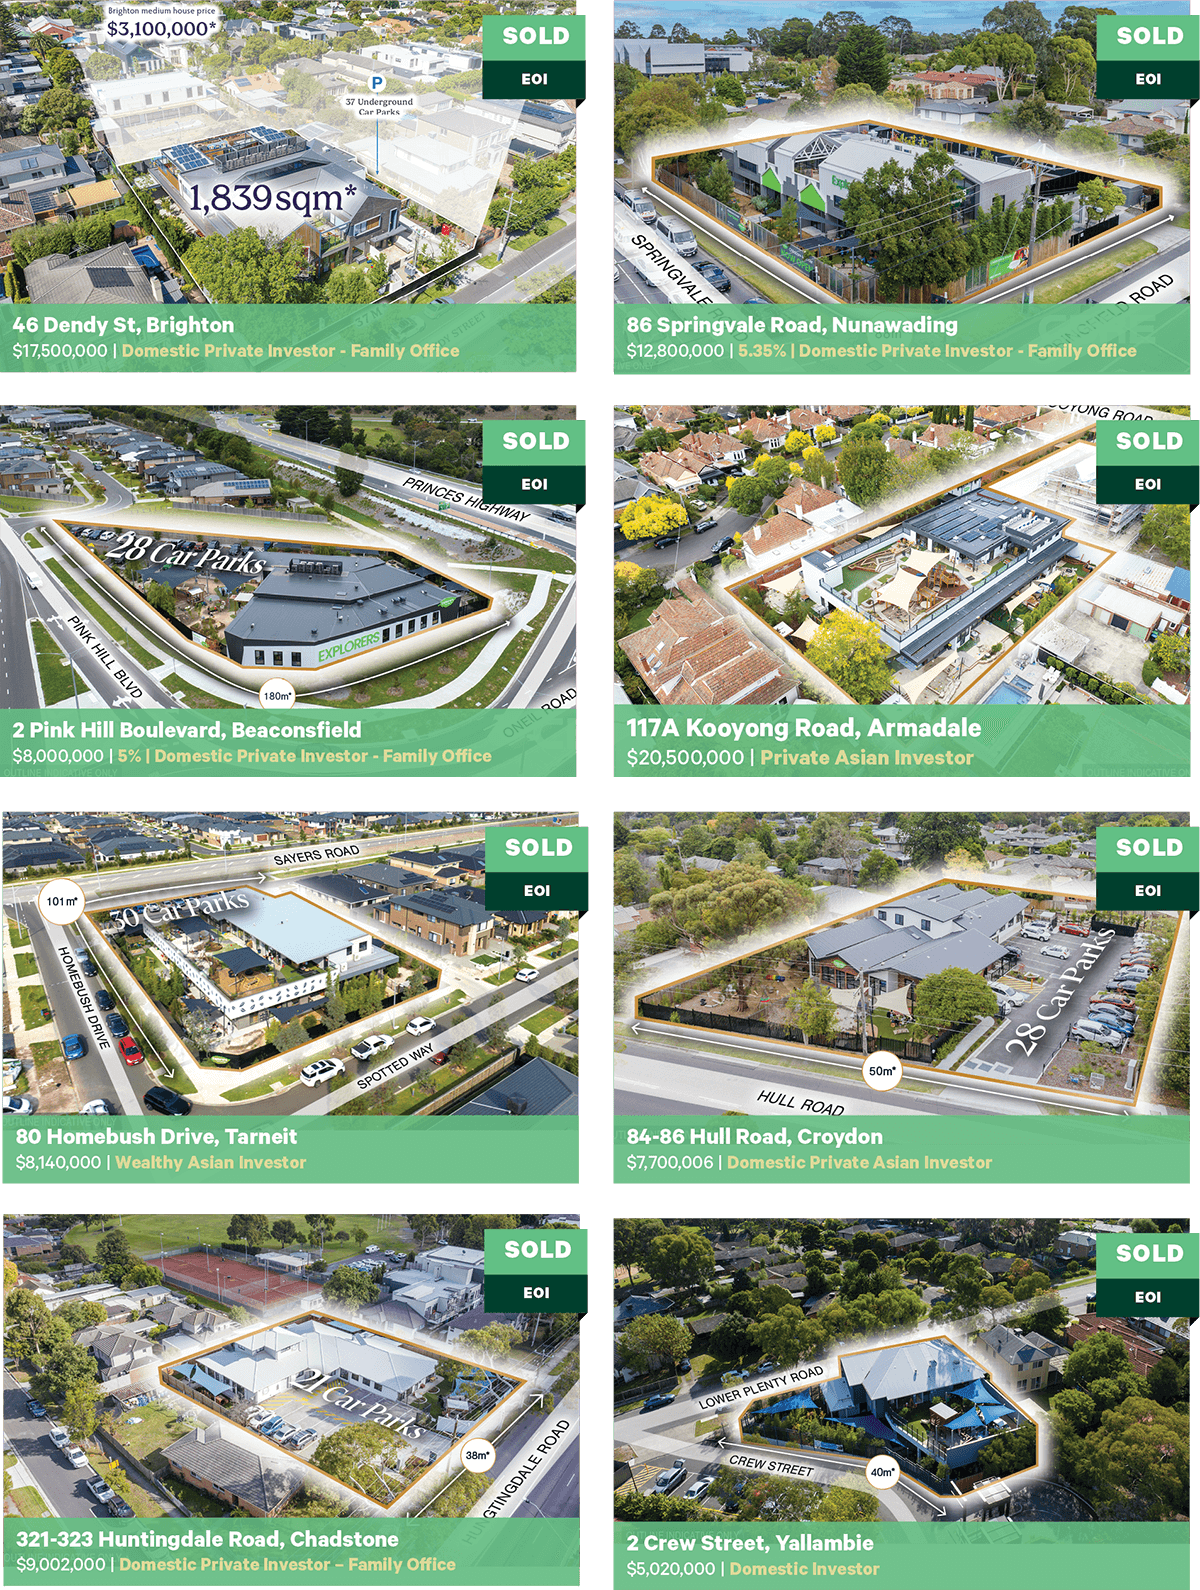
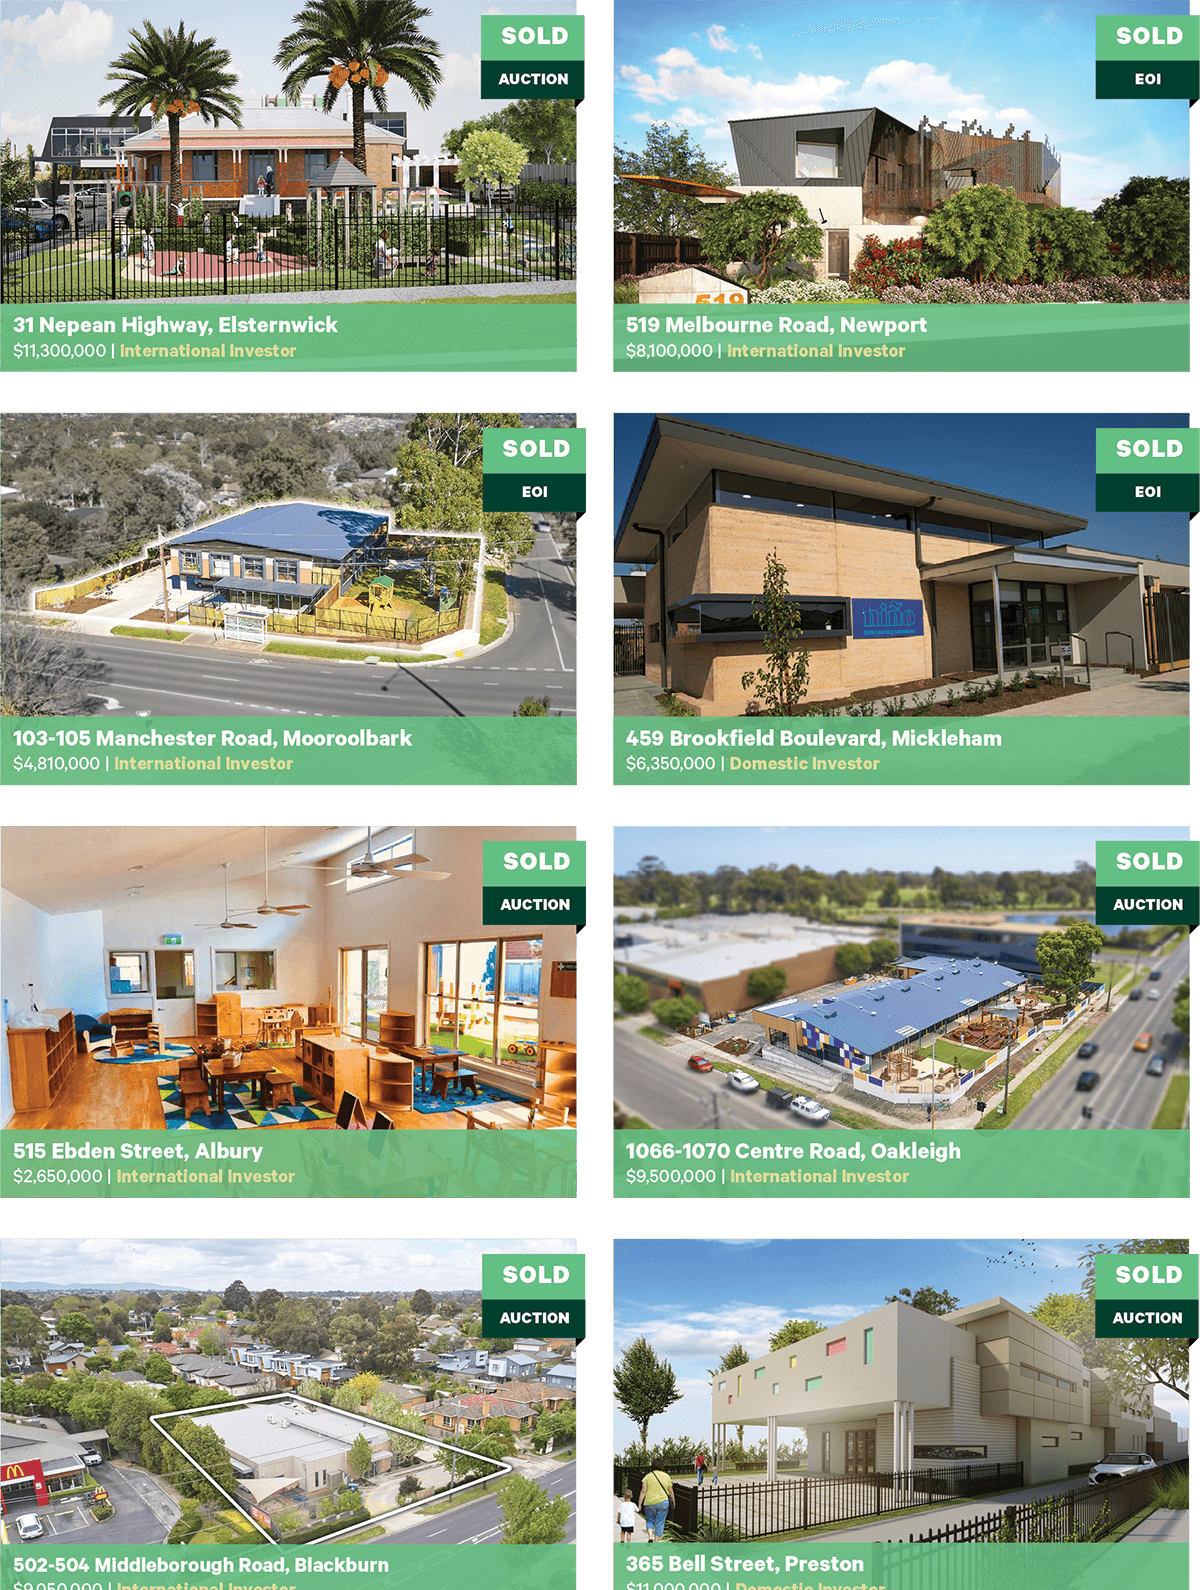
Victoria

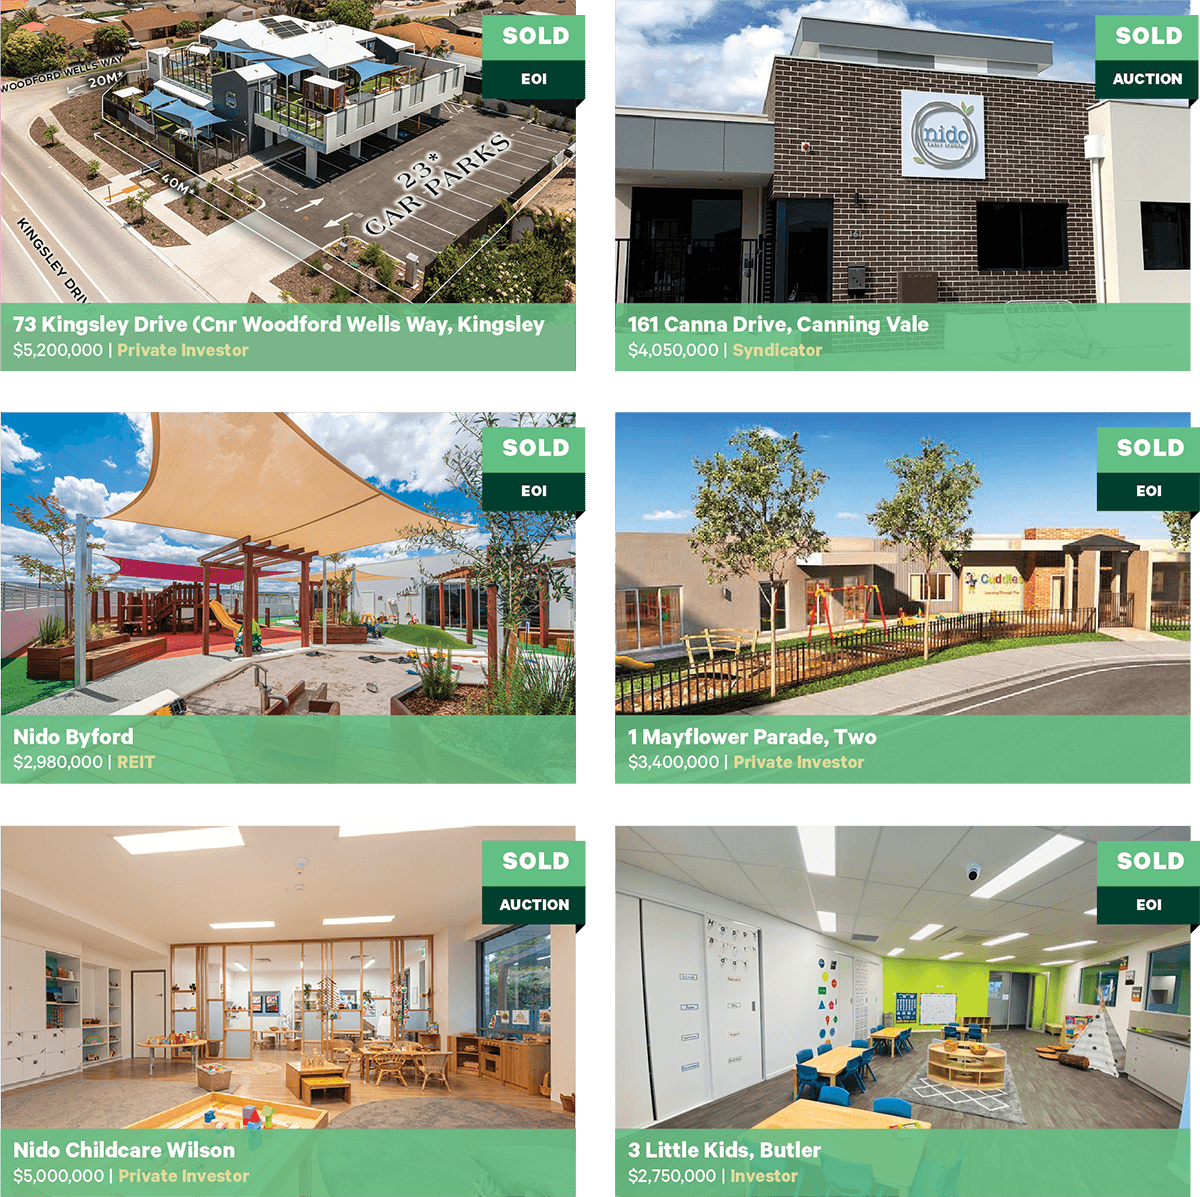
Our Track Record

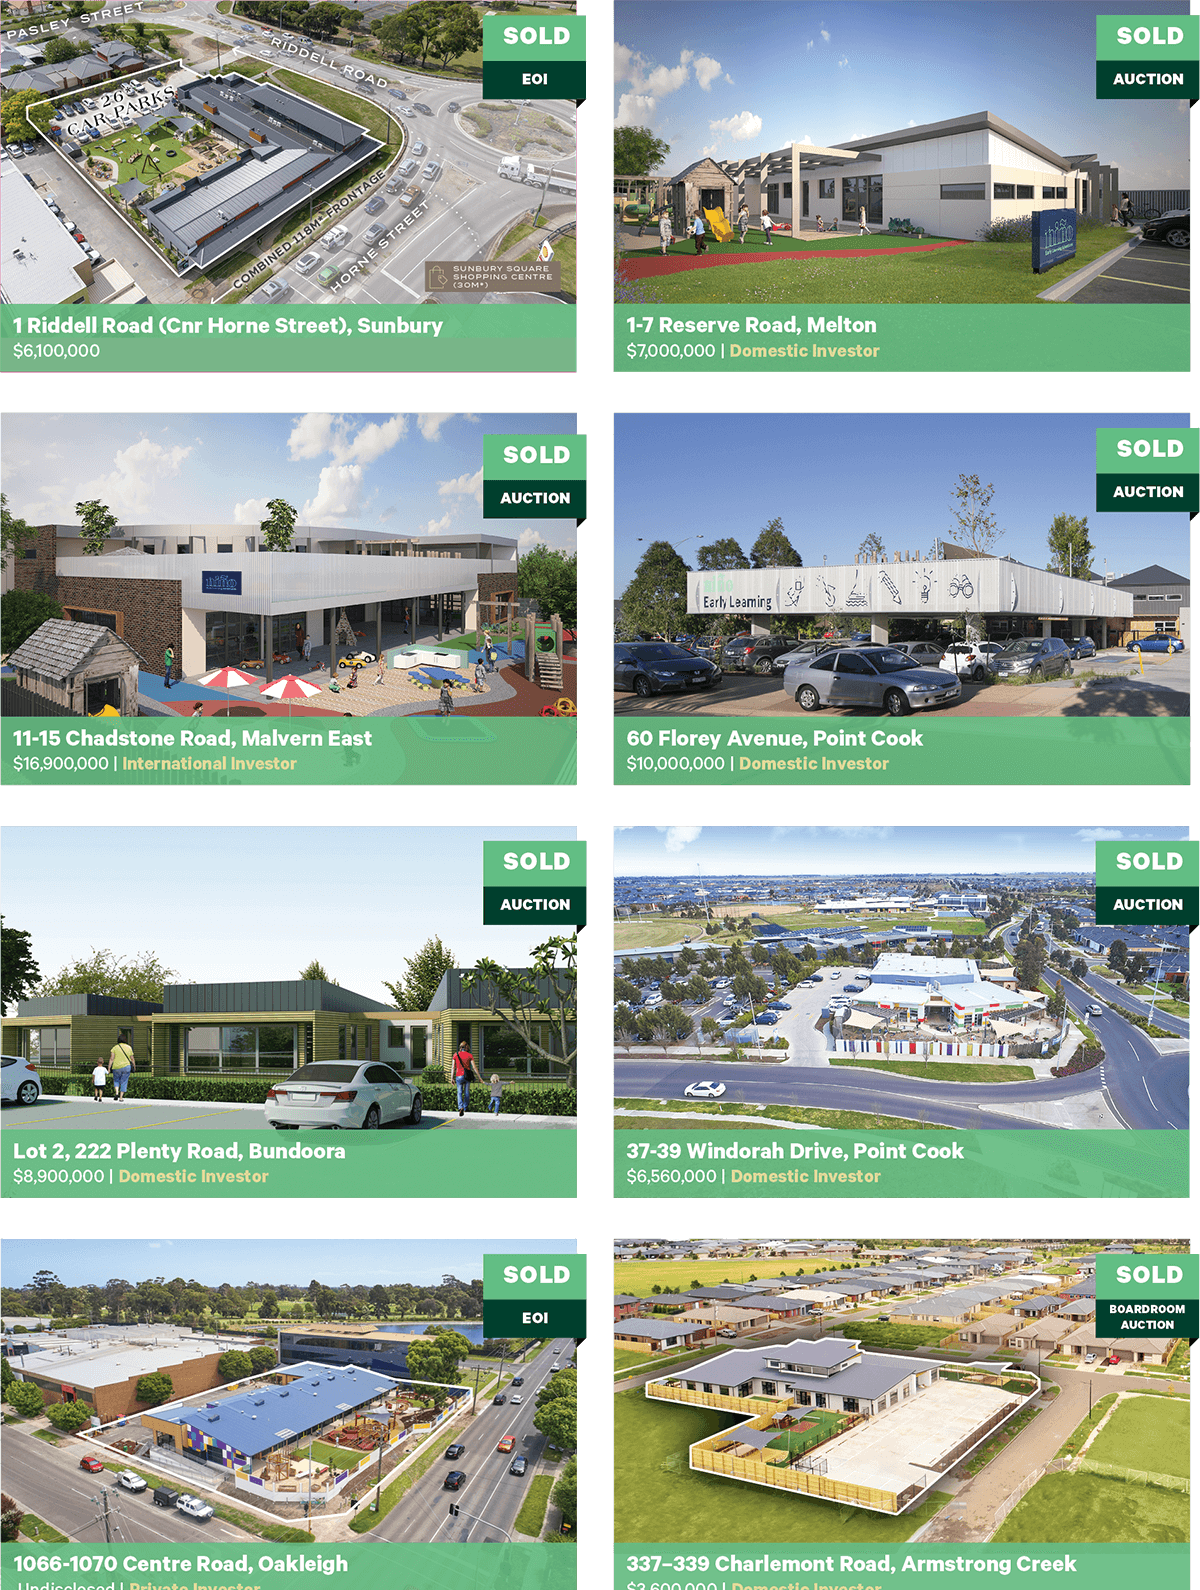
Victoria

Our Track Record

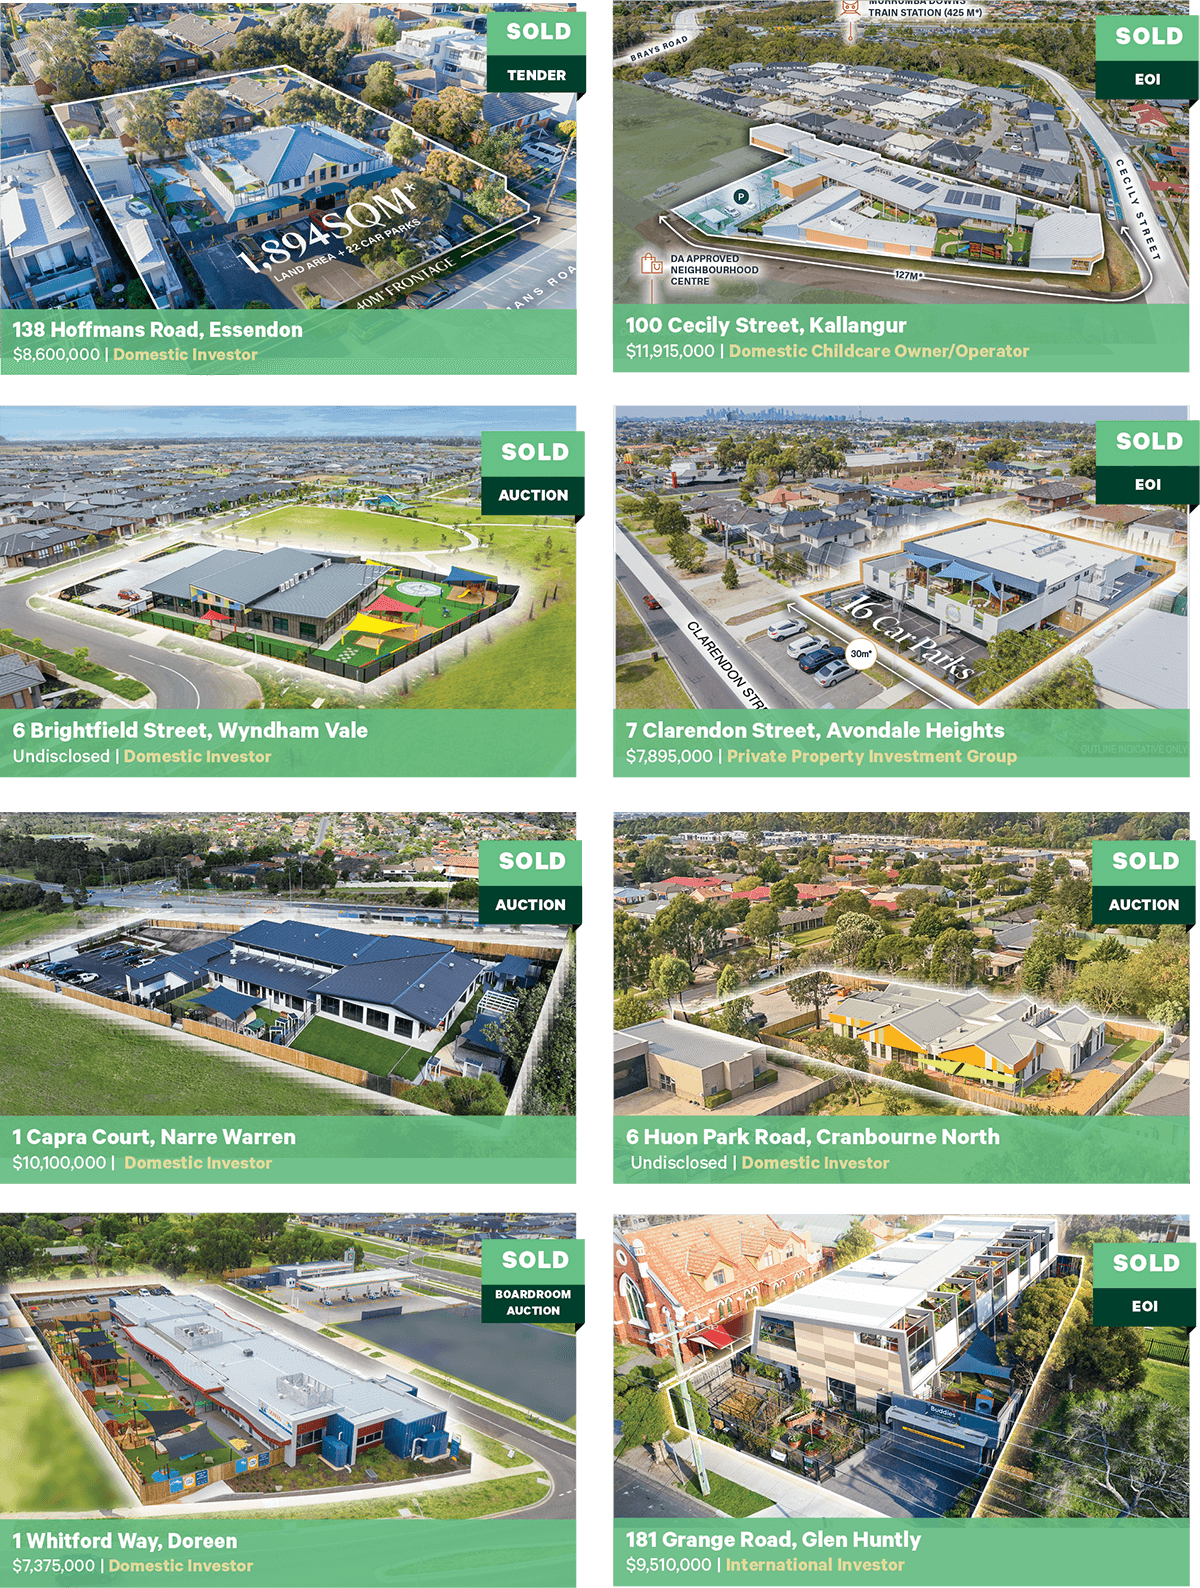
Victoria

Our Track Record

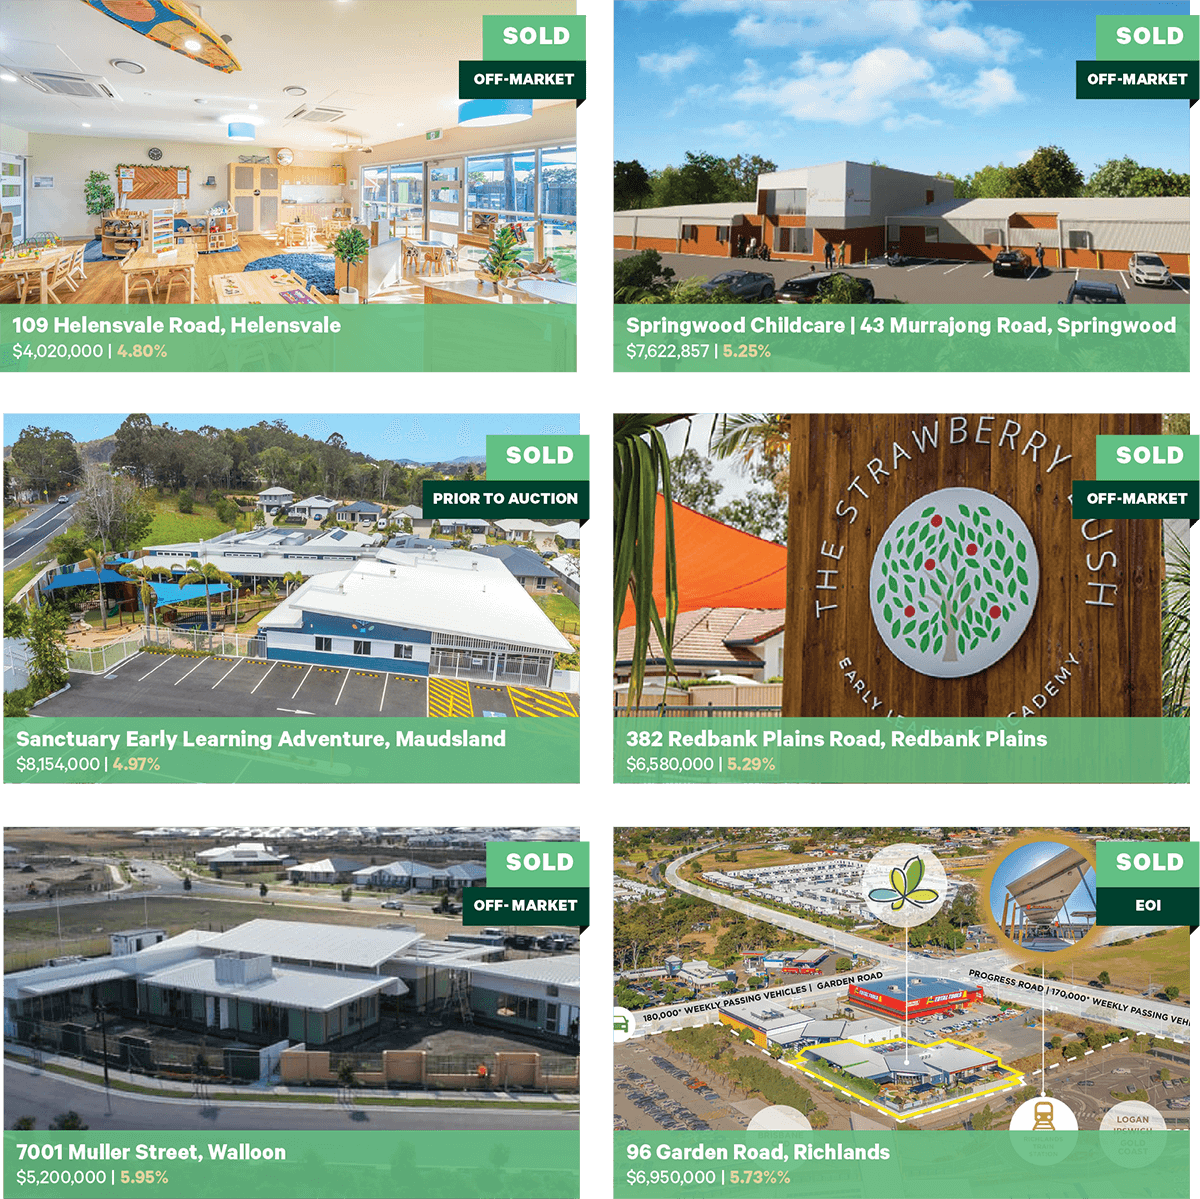
Queensland

Our Track Record

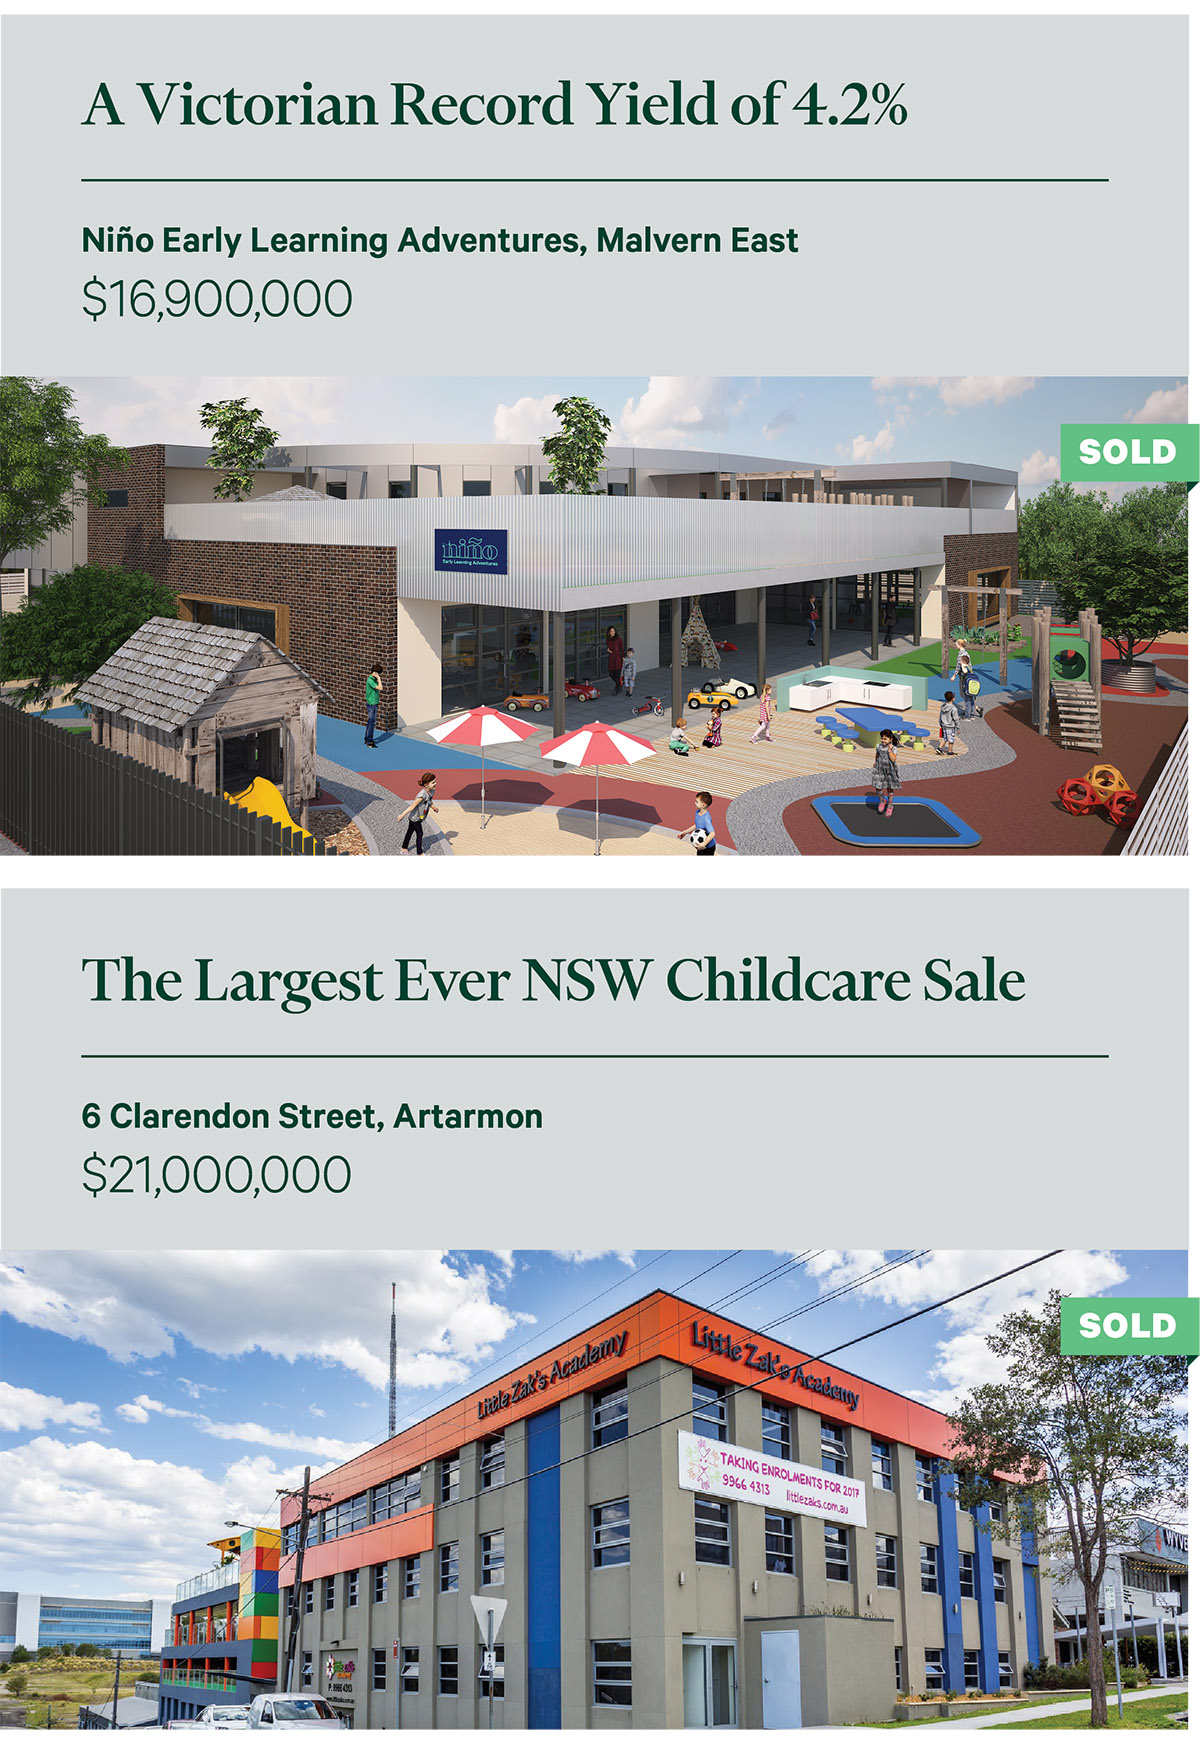
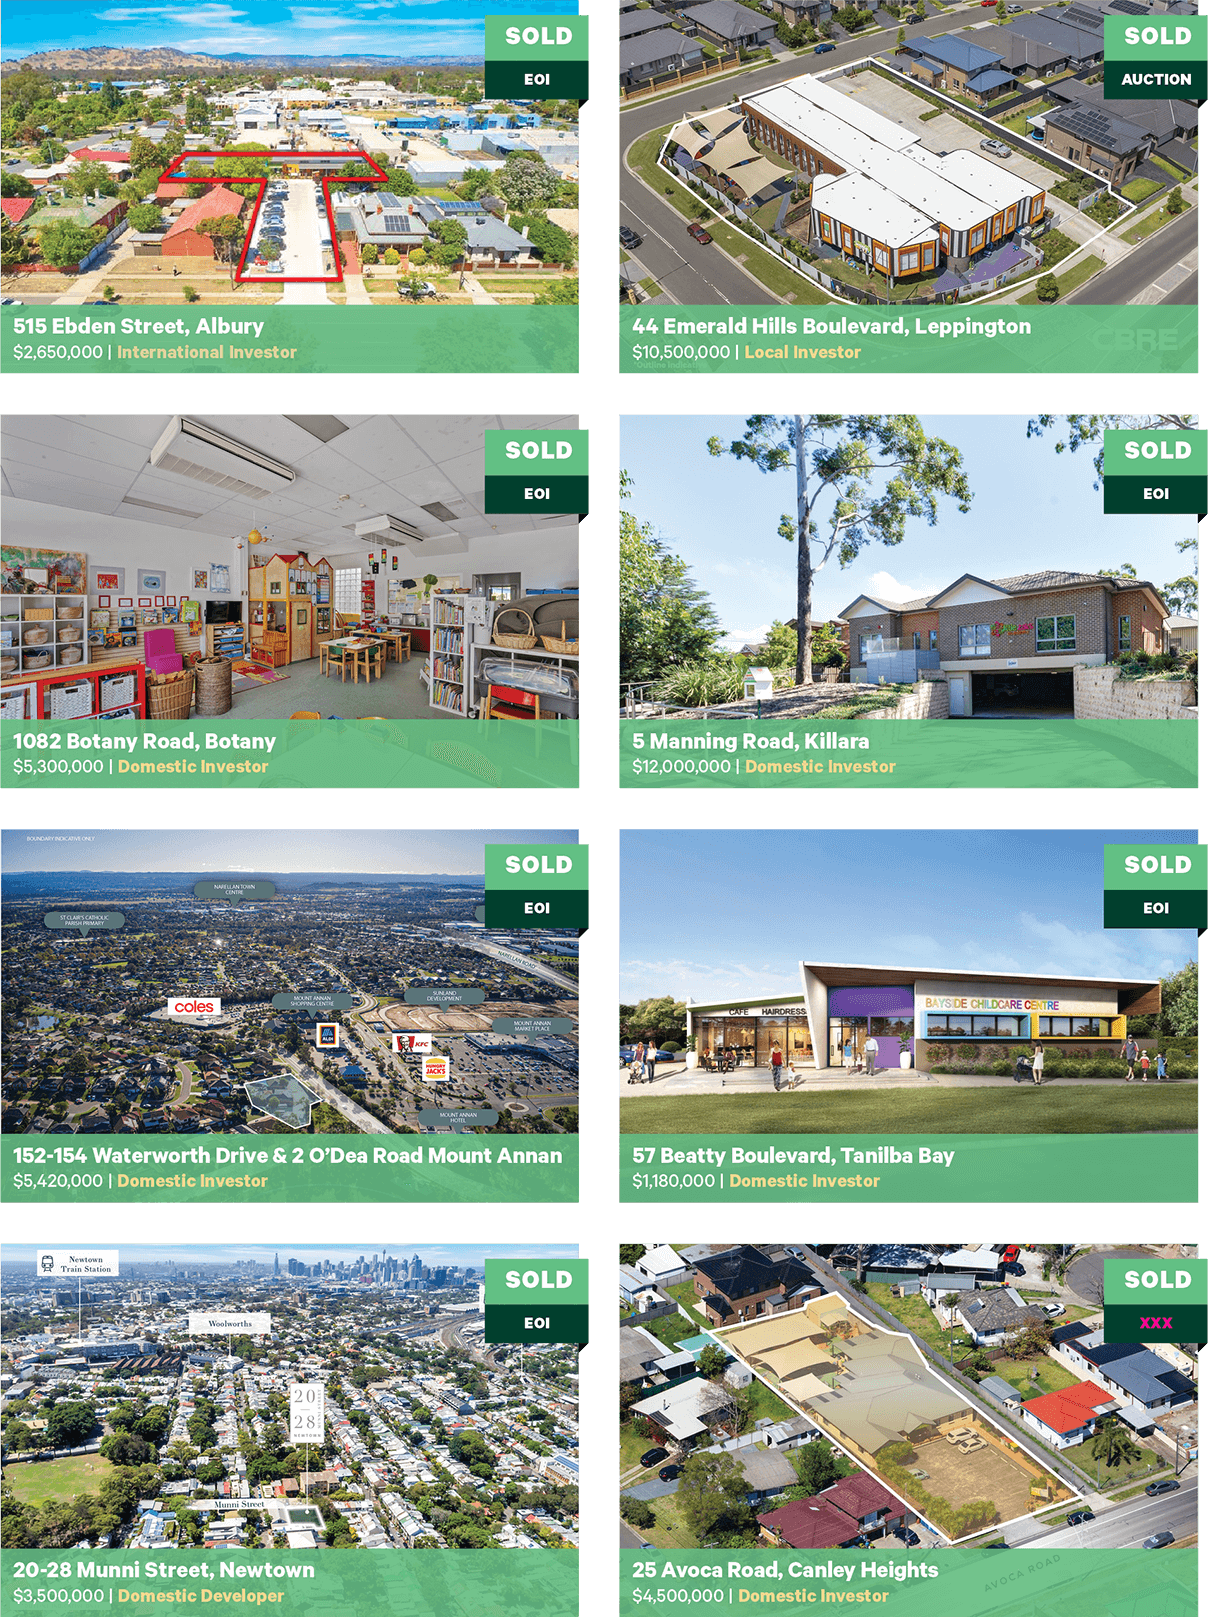
New south wales

Our Track Record

Western Australia

Our Track Record

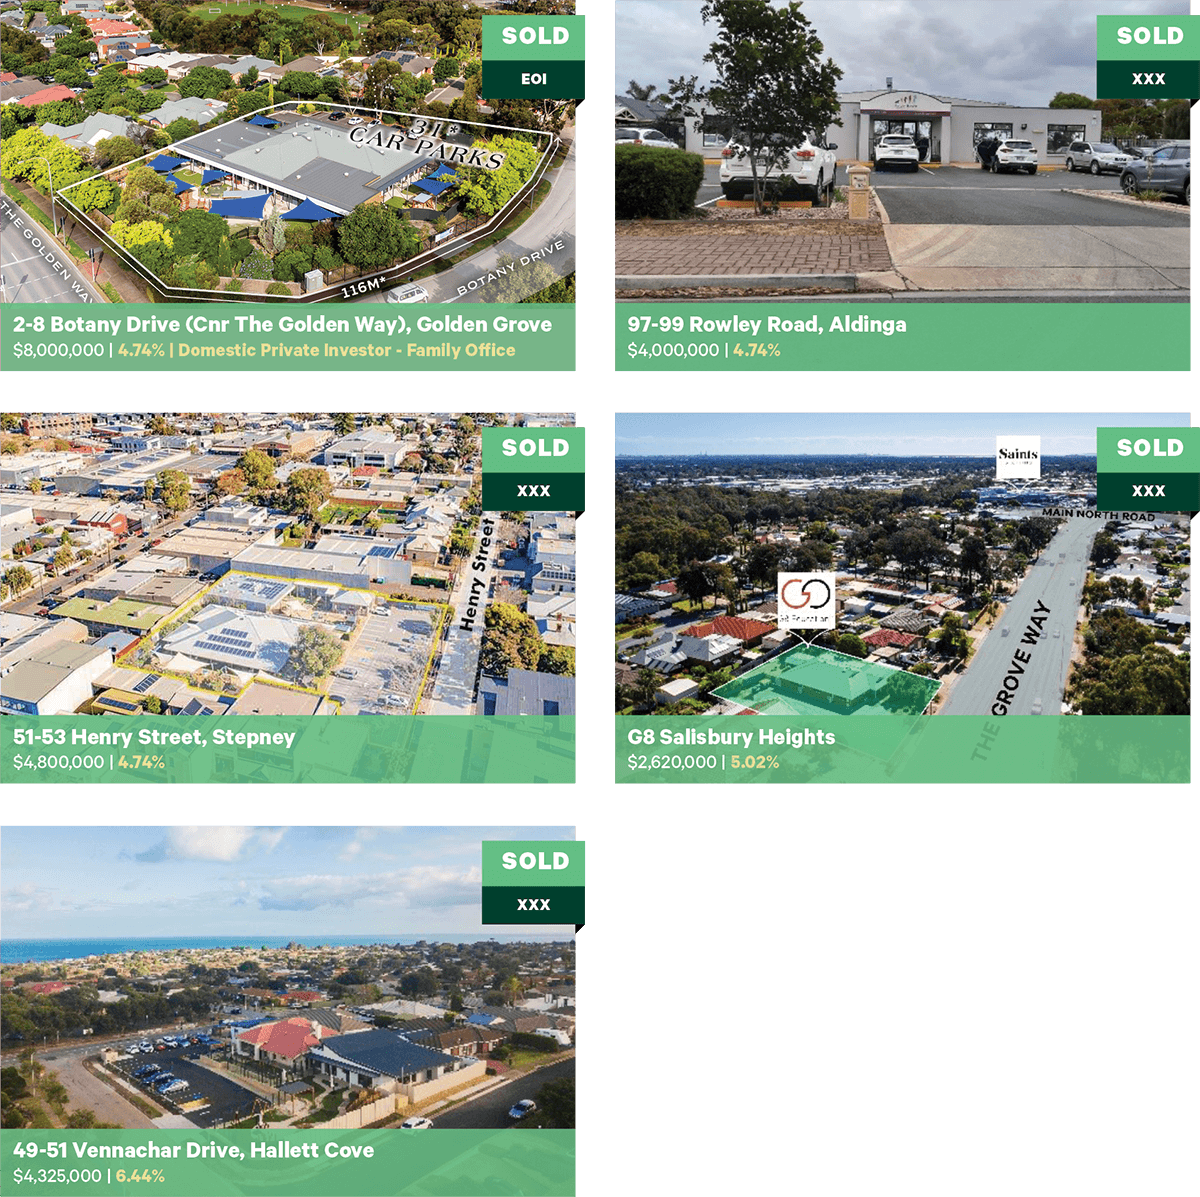
South Australia

Our Track Record

Did you know that cbre specialise in:

  • Childcare investment sales
  • Childcare leasing
  • Childcare business sales

FINDING ONLY THE BEST TENANTS AND BUYERS FOR YOUR PROPERTY OR BUSINESS

Industry Snapshot

Key External Drivers

Funding Analysis and Uptake

The Australian Government is taking measures to make childcare more affordable and to improve conditions for the early childhood education and care (ECEC) sector. This social assistance has been put in place to help families with the cost of raising children:

HIGHER FUNDING WITH TRENDS TOWARDS CHEAPER CHILDCARE

Cheaper Child Care

From 10 July 2023, the Child Care Subsidy rates increased which means most families using childcare now receive more subsidy. The CCS percentage you’re entitled to depends on your family’s income.

The maximum amount of CCS increased from 85% to 90% for families earning up to $80,000. The income limit for CCS also increased from $356,756 to $530,000.

The maximum amount of CCS of 90% will go down by 1% for each $5,000 of income your family earns. You’ll either getmore subsidy or have no change to your entitlement.

If you have more than one child aged 5 or under, you may receive a higher CCS rate for one or more of your children. The low income limit for Additional Child Care Transition to Work subsidy has also increased to $80,000.

Demographics and Demand – Families using Childcare

As cost of living continues to increase year-on-year, the days of single income households are slowly fading away.

Therefore the childcare sector plays a major role in this movement. Below is a breakdown of family income threshold, where it can be seen that the government subsidy covers close to 92% of Australian families.

Families using childcare by income, in range of each combined family cap threshold*

How diminishing supply will fuel yield compression

The data is undeniable. The pipeline of future childcare development opportunities is shrinking, and at a rapid rate. Much like many developments across the country, rising costs and land values are making many projects unfeasible until rents catch up. We are seeing this firsthand across our childcare leasing transaction volumes. While overall leasing transactions in 2023 were at record levels, the current and future supply of centres being developed and permits lodged are in decline. The graph below based on Victorian data is a real time case study of this impact.

As more investors become acutely aware of this decline, they know their window of investment opportunity is closing. With numerous high-quality centres marketed in 2023, buyers have seen this as potentially their last opportunity for a number of years to add a modern and long term leased asset to their portfolio. While older centres may still be marketed, these opportunities will not carry the same significant depreciation benefits most buyers seek.

Drivers of Demand HSI Childcare Trends

As a result of analysis and active daily discussions with developers and investors across the sector, it has become clear to our business that the key drivers of continued demand across the childcare sector are:

Decreasing investment opportunities / development volume

Investment opportunities within the Childcare sector are diminishing at a great rate due to the rapid decline in new developments and the limited number of property transactions for established centres. The scarcity of high-quality childcare investment properties means that for those that do come to market, competition is tight as investors are actively seeking to add secure and long term leased assets to their portfolio.

Victorian Childcare Development Pipeline

Sector stability and operator success

Consistent government support and increased government funding to the industry, along with further promised support, is a key driver of investor appetite and investment in this sector.

The industry was also one of few which performed with continued strength over the course of 2019-2021 with minimal to no rent relief sought by tenants. This has resulted in positive word of mouth and existing owners seeking growth in the number of their existing holdings.

Medium – Long-term Investment analysis

The view of many astute investors (subject to strategy) is that declining development volume will result in reduced market supply and ultimately drive pricing upward; available capital will chase too few investments.

This expected steep price increase may be driven even higher by predicted future rate cuts.

In short the view from many is to get in on the ground floor before the wider market becomes aware of this declining supply and before prices skyrocket.

A similar train of thought is being held by many short to medium term investors. These buyer profiles are of the view they can purchase now and will likely re-value their holding in 1-2 years’ time as yields compress and rental increases take effect. They can then withdraw this equity for future investments or realise their capital growth.

Revenue

With both State and Federal Government support, the ECEC/childcare sector is expected to continue to raise annual revenue projections for the industry. This support will continue to keep annual growth steady as demand in some areas outstrips supply and the requirement to develop new centres continues to push growth within the sector.

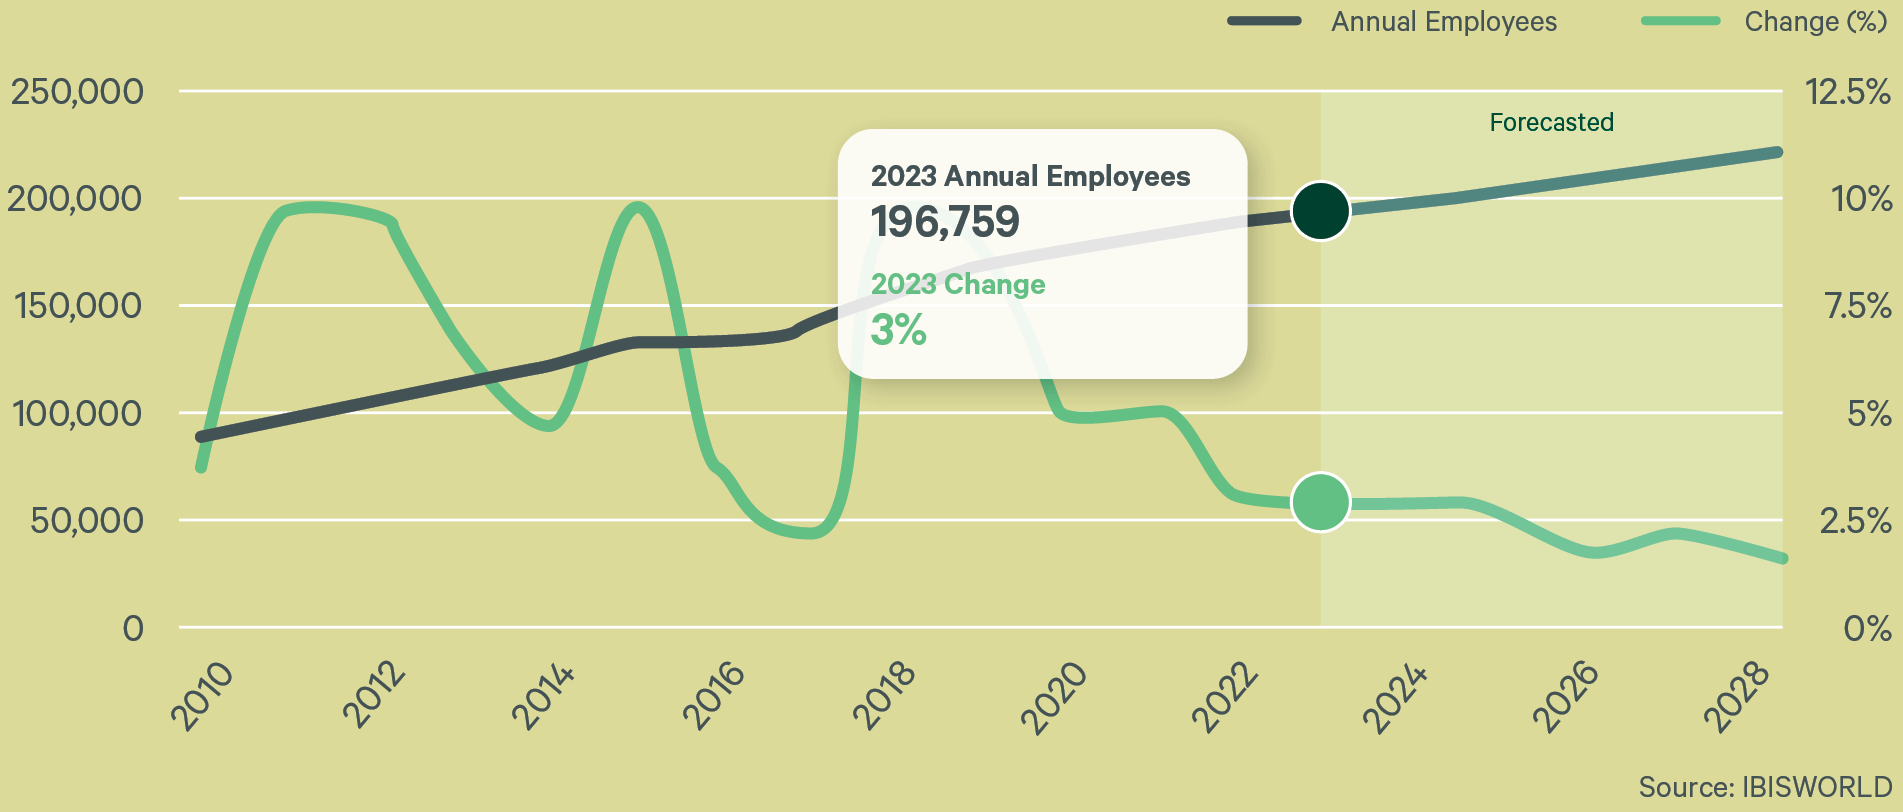
Employment in Childcare

Employment costs in the Childcare sector are by far the largest costs for childcare businesses. This continues to grow as staff shortages and the need to retain staff are contributing to the rising wages.

Wage costs is an issue we highlighted in the COVID-19 period where staff were near impossible to find for some operators, resulting in centre closures.

Wages account for 59.1% of revenue in 2022-23*.

Total value ($) and annual change from 2010 – 2028 . Includes 5-year outlook.

Total value ($) and annual change from 2010 – 2028 . Includes 5-year outlook.

Major Players 2023

Industry Structure

Characteristics Level Trend
Concentration Low
Barriers To Entry Moderate Increasing
Regulation and Policy High Increasing
Life Cycle Growth
Revenue Volatility Low
Capital Intensity Low
Assistance High Increasing
Competition Low Increasing
Innovation Moderate

Source: IBISWORLD

The childcare industry has been operating under a unique set of characteristics (refer to table - left) which has allowed for a relatively stable market to-date.

A few notable trends have been emerging over the past few years which will likely shake up the market:

  • Barriers to entry increasing; changes to regulations, increase cost of setup and lack of opportunities.
  • Regulations and Policy increasing; making it more difficult for new entrants and existing larger operators to review their strategy to keep afloat.
  • Increasing government assistance to families and operators; this allowed for many for-profit and non-for profits to shelter through the COVID-19 storm.
  • Increasing competition; the sector is gaining notice as to strong profitability when a childcare centre is run efficiently.

“It’s no surprise to our team that Childcare investments are highly sought after. We have also witnessed first-hand significant growth in the Childcare leasing market. As Childcare centre and operator profits continue to go from strength-to-strength, despite a challenging economic backdrop, investor and leasing demand continues to grow.”

Marcello Caspani- Muto

Market Activity

Childcare Transactions in Review

Over the past 12 months, a consistent and stable flow of sales activity nationally was seen. This was despite the economic slowdown in the second half of 2023, as experienced across all industry sectors. While yields have softened an average of 75 basis points, stabilisation in these results is expected across most of 2024 with the potential for yield compression once again in Q3 or Q4.

Market Analysis

An average market yield of 5.25-5.5% has been derived as a result of numerous notable early learning transactions by the CBRE Australian Healthcare & Social Infrastructure team.

Information provided below reflects the lion’s share of sales activity across the country with CBRE selling 100% of all childcare centres above $9m in 2023 while holding a national Australian market share of 60% across all price points.

Some notable transactions which have been true indicators of positive investor sentiment toward the asset class are the sale of 117 Kooyong Road, Armadale which sold for $20,500,000 reflecting a yield of 4.5% and 321-323 Huntingdale Road, Chadstone which sold for $9,000,000 reflecting a yield of 4.9%. Both sales occurred at the peak of Australia’s rate rises.

Demographics

Projected Population, Australia

Estimated change in 0-4 year olds

Australia’s population at 30 June 2017 of 24.6 million is projected to increase by an annual average of between 1.4% to 1.8% until June 2027 and reach between 28.3 and 29.3 million people by 2027.

Showing a strong national population growth overall and state by state breakdown:

  • Sydney is projected to increase from 65% of the state’s population in 2017 to between 67% and 68% in 2027.
  • Melbourne is projected to increase from 77% of Victoria in 2017 to 79% in 2027.
  • Brisbane is projected to increase from 49% of Queensland’s population to 51% in 2027, becoming the majority part of Queensland’s population.
  • Adelaide is projected to grow from 77% in 2017 to between between 78% and 79% in 2027.
  • Perth is projected to grow from 79% to between 80% and 81%.
  • Hobart is projected to increase its share of Tasmania’s population, from 44% in 2017 to 46% in 2027.
  • Darwin is projected to increase its share of the territory’s population by more than any other capital city, increasing from 60% in 2017 to between 63% and 64% in 2027.

Nationally, the number of 0-4 year olds is estimated to increase by 19,000 over next 10 years and 205,000 over next 20 years.

The 0-4 age group forecast continues to grow nationally with the number increasing by 19,000 over the next 10 years and 205,000 over the next 20 years. These key indicators suggest a steady and continued demand for childcare services .

Source: Centre for Population 2022, National population projections in the 2022-23 Budget, the Australian Government, Canberra.

Australian Healthcare
and Social Infrastructure

Sandro Peluso

+61 418 389 757
sandro.peluso@cbre.com

Marcello Caspani-Muto

+61 417 065 777
marcello.caspanimuto@cbre.com

ASIA Pacific Capital SERVICES

Jimmy Tat 毕家辉

+61 439 399 118
jimmy.tat@cbre.com

Kai Wang 王凯

+61 431 898 531
kai.wang@cbre.com

Australian Healthcare
and Social Infrastructure